Querying metadata in ECS

AWS provides two methods to access instance metadata (Instance Metadata Service): IMDSv2 and IMDSv1. While both versions are enabled by default, IMDSv2 offers enhanced security through session-oriented requests. This newer version requires a session token for authentication, unlike IMDSv1’s simpler request/response method. For detailed examples and SDK compatibility information, refer to: How to use the Instance Metadata Service to access instance metadata.

Task metadata available for ECS on Amazon EC2

If your Amazon ECS task is hosted on Amazon EC2, you can access task host metadata using the Instance Metadata Service (IMDS) endpoint: http://169.254.169.254/latest/meta-data/

You can access to the instance metadata categories predefined or dynamic data metadata generated when the instance is launched.

For example to get the private IPv4 address of the instance “http://169.254.169.254/latest/meta-data/local-ipv4”.

Using IMDSv1, no token is required:

curl http://169.254.169.254/latest/meta-data/local-ipv4

Output:

10.1.2.22

IMDSv2 uses token-backed sessions, querying this endpoint having IMDSv2 enabled it will throw HTTP 401 error:

curl http://169.254.169.254/latest/meta-data/local-ipv4 -v

Result:

* Trying 169.254.169.254:80...
* Connected to 169.254.169.254 (169.254.169.254) port 80 (#0)
> GET /latest/meta-data/local-ipv4 HTTP/1.1
> Host: 169.254.169.254
> User-Agent: curl/7.88.1
> Accept: */*
>
< HTTP/1.1 401 Unauthorized
< Content-Length: 0
< Date: Wed, 11 Jun 2025 16:36:27 GMT
< Server: EC2ws
< Connection: close
< Content-Type: text/plain
<
* Closing connection 0
* 

When using IMDSv2 you need to get an ec2-metadata-token first and then use that token in the header to get the metadata information.

TOKEN=`curl -X PUT "http://169.254.169.254/latest/api/token" -H "X-aws-ec2-metadata-token-ttl-seconds: 21600"` && curl -H "X-aws-ec2-metadata-token: $TOKEN" -v http://169.254.169.254/latest/meta-data/local-ipv4

Result:

*   Trying 169.254.169.254:80...
* Connected to 169.254.169.254 (169.254.169.254) port 80 (#0)
> GET /latest/meta-data/local-ipv4 HTTP/1.1
> Host: 169.254.169.254
> User-Agent: curl/7.88.1
> Accept: */*
> X-aws-ec2-metadata-token: AQAEANJUjYU8d-jCP2lrxvPsC3ZgtDtbC41XuK1ddC_ONwyfidlOmw==
>
< HTTP/1.1 200 OK
< X-Aws-Ec2-Metadata-Token-Ttl-Seconds: 21600
< Content-Type: text/plain
< Accept-Ranges: none
< Last-Modified: Wed, 11 Jun 2025 15:38:21 GMT
< Content-Length: 10
< Date: Wed, 11 Jun 2025 15:49:23 GMT
< Server: EC2ws
< Connection: close
<
* Closing connection 0
10.1.2.194

Important: This approach just works in your ECS Task is hosted on Amazon EC2 and not for Fargate.

Using SDK for ECS on Amazon EC2

For example using JavaScript SDK with IMDSv1.

const AWS = require("aws-sdk");
const meta = new AWS.MetadataService();

app.get('/', (req, res) => {
    const response = { message: 'Response back from Express REST API' };
    meta.request("/latest/meta-data/local-ipv4", function (err, data) {
        if (err) {
            response.error = "Error fetching local IPv4 address";
            res.status(500).json(response);
        } else {
            response.localIpv4 = data;
            res.json(response);
        }
    });
});

If IMDSv2 is enabled previous code will fail with the following error:

Response back from Express REST API
Error fetching local IPv4 address:  Error: null
    at IncomingMessage.<anonymous> (/app/node_modules/aws-sdk/lib/util.js:930:34)
    at IncomingMessage.emit (node:events:526:35)
    at IncomingMessage.emit (node:domain:488:12)
    at endReadableNT (node:internal/streams/readable:1408:12)
    at process.processTicksAndRejections (node:internal/process/task_queues:82:21) {
  statusCode: 401,
  retryable: false,
  time: 2025-06-11T17:30:50.372Z
}

If you are migrating from IMDSv1 to IMDSv2 using EC2 and JavaScript SDK you need to get first the token and then request the metadata endpoint as followed:

const AWS = require("aws-sdk");
const meta = new AWS.MetadataService();

app.get('/', (req, res) => {
    console.log('Response back from Express REST API');
    // Fetching the local IPv4 address from AWS Metadata Service
    const response = { message: 'Response back from Express REST API' };
    meta.fetchMetadataToken(function (err, token) {
        if (err) {
            console.error("Error fetching metadata token: ", err);
            response.error = "Error fetching metadata token";
            res.status(500).json(response);
            return;
        } else {
            meta.request("/latest/meta-data/local-ipv4", { headers: { "x-aws-ec2-metadata-token": token } },
                function (err, data) {
                    if (err) {
                        console.error("Error fetching local IPv4 address: ", err);
                        response.error = "Error fetching local IPv4 address";
                        res.status(500).json(response);
                        return;
                    } else {
                        console.log("Local IPv4 address: ", data);
                        response.localIpv4 = data;
                        res.json(response);
                    }
                }
            );
        }
    });
});

Important: This approach just works in your ECS Task is hosted on Amazon EC2 and not for Fargate.

If you run this code in ECS Fargate you won’t find the endpoint, example:

Error fetching local IPv4 address: Error: connect EINVAL 169.254.169.254:80 - Local (0.0.0.0:0)
    at internalConnect (node:net:1090:16)
    at defaultTriggerAsyncIdScope (node:internal/async_hooks:464:18)
    at node:net:1315:9
    at process.processTicksAndRejections (node:internal/process/task_queues:77:11) {
        errno: -22,
        code: 'EINVAL',
        syscall: 'connect',
        address: '169.254.169.254',
        port: 80
    }

Task metadata available for Amazon ECS tasks on Fargate

From ECS Fargate you can’t reach the EC2 endpoint 169.254.169.254 directly. In order to query the metadata, you need to use the environment variables endpoints injected into each container in a task. There are different task metadata versions, the latest one is v4. Refer to Amazon ECS task metadata endpoint version 4 for tasks on Fargate. These endpoints can varies depending on the Fargate version you are using (v2,v3,v4).

Using Fargate you can use the following endpoint 169.254.170.2/v4/metadata

Each endpoint will provide similar data or extra fields, review the json structure to get specific data.

  • ${ECS_CONTAINER_METADATA_URI_V4} - Returns metadata for the container.
  • ${ECS_CONTAINER_METADATA_URI_V4}/task - Returns metadata for the task, including a list of the container IDs and names for all of the containers associated with the task.
  • ${ECS_CONTAINER_METADATA_URI_V4}/stats - Returns Docker stats for the Docker container.

Displaying information using endpoint ECS_CONTAINER_METADATA_URI

echo  $ECS_CONTAINER_METADATA_URI
http://169.254.170.2/v3/c1b6da455882403b887d939f500f0884-2531612879
root@ip-10-1-2-22:/curl http://169.254.170.2/v3/c1b6da455882403b887d939f500f0884-2531612879

Output:

{
    "DockerId": "c1b6da455882403b887d939f500f0884-2531612879",
    "Name": "nginx",
    "DockerName": "nginx",
    "Image": "nginx:latest",
    "ImageID": "sha256:6784fb0834aa7dbbe12e3d7471e69c290df3e6ba810dc38b34ae33d3c1c05f7d",
    "Labels": {
        "com.amazonaws.ecs.cluster": "arn:aws:ecs:us-east-1:000000000:cluster/ecs-fargate",
        "com.amazonaws.ecs.container-name": "nginx",
        "com.amazonaws.ecs.task-arn": "arn:aws:ecs:us-east-1:000000000:task/ecs-fargate/c1b6da455882403b887d939f500f0884",
        "com.amazonaws.ecs.task-definition-family": "fargate-nginx",
        "com.amazonaws.ecs.task-definition-version": "5"
    },
    "DesiredStatus": "RUNNING",
    "KnownStatus": "RUNNING",
    "Limits": {
        "CPU": 2
    },
    "CreatedAt": "2025-06-11T15:25:12.692595904Z",
    "StartedAt": "2025-06-11T15:25:12.692595904Z",
    "Type": "NORMAL",
    "Networks": [
        {
            "NetworkMode": "awsvpc",
            "IPv4Addresses": [
                "10.1.2.22"
            ]
        }
    ]
}

From the previous output you can get the private ip assigned using this code:

const axios = require('axios');

app.get('/fargate', async (req, res) => {
    console.log('Response back from Express REST API for Fargate');
    const response = { message: 'Response back from Express REST API for Fargate' };
    const metadataUrl = process.env.ECS_CONTAINER_METADATA_URI;

    if (!metadataUrl) {
        response.error = "ECS_CONTAINER_METADATA_URI_V4 environment variable not set";
        return res.status(500).json(response);
    }

    try {
        const metaRes = await axios.get(metadataUrl);
        const metaData = metaRes.data;
        response.metadata = metaData;

        // Extract private IP from Networks[0].IPv4Addresses[0]
        let privateIp = null;
        if (
            Array.isArray(metaData.Networks) &&
            metaData.Networks.length > 0 &&
            Array.isArray(metaData.Networks[0].IPv4Addresses) &&
            metaData.Networks[0].IPv4Addresses.length > 0
        ) {
            privateIp = metaData.Networks[0].IPv4Addresses[0];
        }
        response.privateIp = privateIp;

        res.json(response);
    } catch (err) {
        console.error("Error fetching Fargate metadata: ", err);
        response.error = "Error fetching Fargate metadata";
        res.status(500).json(response);
    }
});

References

How to recover a docker image from Kubernetes Node

When you’ve lost a Docker image from your remote repository but it’s still cached on a Kubernetes Node, you can recover it using containerd’s command-line tool, ctr. This tool is typically bundled with containerd installations.

Using ctr

ctr, often included in containerd installations, can be used in conjunction with crictl, a standalone kubernetes-sigs project. Here’s how to interact with ctr and containerd:

  1. Set up the environment: To interact with ctr define this environment variable:

    export CONTAINER_RUNTIME_ENDPOINT="unix:///run/containerd/containerd.sock"

  2. For basic authentication (e.g., with AWS ECR):

     ECR_REGION=us-east-1
     ECR_PASSWORD=$(aws ecr get-login-password --region $ECR_REGION)
    
  3. Tagging and pushing images:

     ctr -n k8s.io image tag <IMAGE> <ECR:IMAGE:TAG>
     ctr -n k8s.io image push --user "AWS:$ECR_PASSWORD" <ECR:IMAGE:TAG>
    

    Note: The ‘k8s.io’ namespace is required for image interactions.

Other Helpful Tools

  • nerdctrl: Docker-compatible CLI for containerd
  • crictl: crictl provides a CLI for CRI-compatible container runtimes.

How To Run Daemonset Pods In Certain Nodes

In scenarios that you want to run a Daemonset, but want to run daemonset pods in specific nodes or avoid running pods without deleting the daemonset for a particular timeframe. You can use labes with nodeSelector.

The nature of a DaemonSet was designed to run one pod per node in your Kubernetes cluster, if you have 3 nodes, you will see 3 daemonset pods running.

To effectively reduce the number of Daemonset pods to 0 without deleting the DaemonSet or to chose which node will be running the daemonset pods, it is recommended to use Node Selectors. Here are two ways to implement this solution:

Setting Labels to Kubernetes Nodes

  1. Add a label to all existing nodes. In this example I will use “fluent-bit=false” to control how many FluentBit Daemonset pods will be running in my nodes. To add a label use this command:

    kubectl get nodes -o name | xargs -I{} kubectl label {} fluent-bit=false --overwrite

    Note: You may need to rerun this command if new nodes are added to the cluster.

  2. Verify the label change:

    kubectl get nodes --show-labels

  3. Modify your DaemonSet manifest adding a new selector:

     nodeSelector:
     kubernetes.io/os: linux
     fluent-bit: "true"
    

    For example:

     apiVersion: apps/v1
     kind: DaemonSet
     metadata:
       name: fluent-bit
       namespace: amazon-cloudwatch
       labels:
         k8s-app: fluent-bit
         version: v1
         kubernetes.io/cluster-service: "true"
     spec:
       selector:
         matchLabels:
           k8s-app: fluent-bit
       template:
         metadata:
           labels:
             k8s-app: fluent-bit
             version: v1
             kubernetes.io/cluster-service: "true"
         spec:
           containers:
             - name: fluent-bit
               image: public.ecr.aws/aws-observability/aws-for-fluent-bit:2.32.4
               imagePullPolicy: Always
           nodeSelector:
             kubernetes.io/os: linux
             fluent-bit: "true"
    
  4. Apply the updated configuration:

    kubectl apply -f <manifest-name>.yaml

  5. Verify that your Daemonset pods are not running.
  6. To re-enable Daemonset pods in the future, you can update the node labels to a desired label and value. e.g. “fluent-bit=true”:

Patching Node Selectors

Patching on the fly. In this case, the command is setting the nodeSelector to include a label “non-existing”: “true”, which means that the fluent-bit pods will only be scheduled on nodes that have this label.

kubectl -n amazon-cloudwatch patch daemonset fluent-bit -p '{
  "spec": {
    "template": {
      "spec": {
        "nodeSelector": {
          "non-existing": "true"
        }
      }
    }
  }
}'

How to Configure LogMonitor and CloudWatch Logs for ECS Windows Tasks

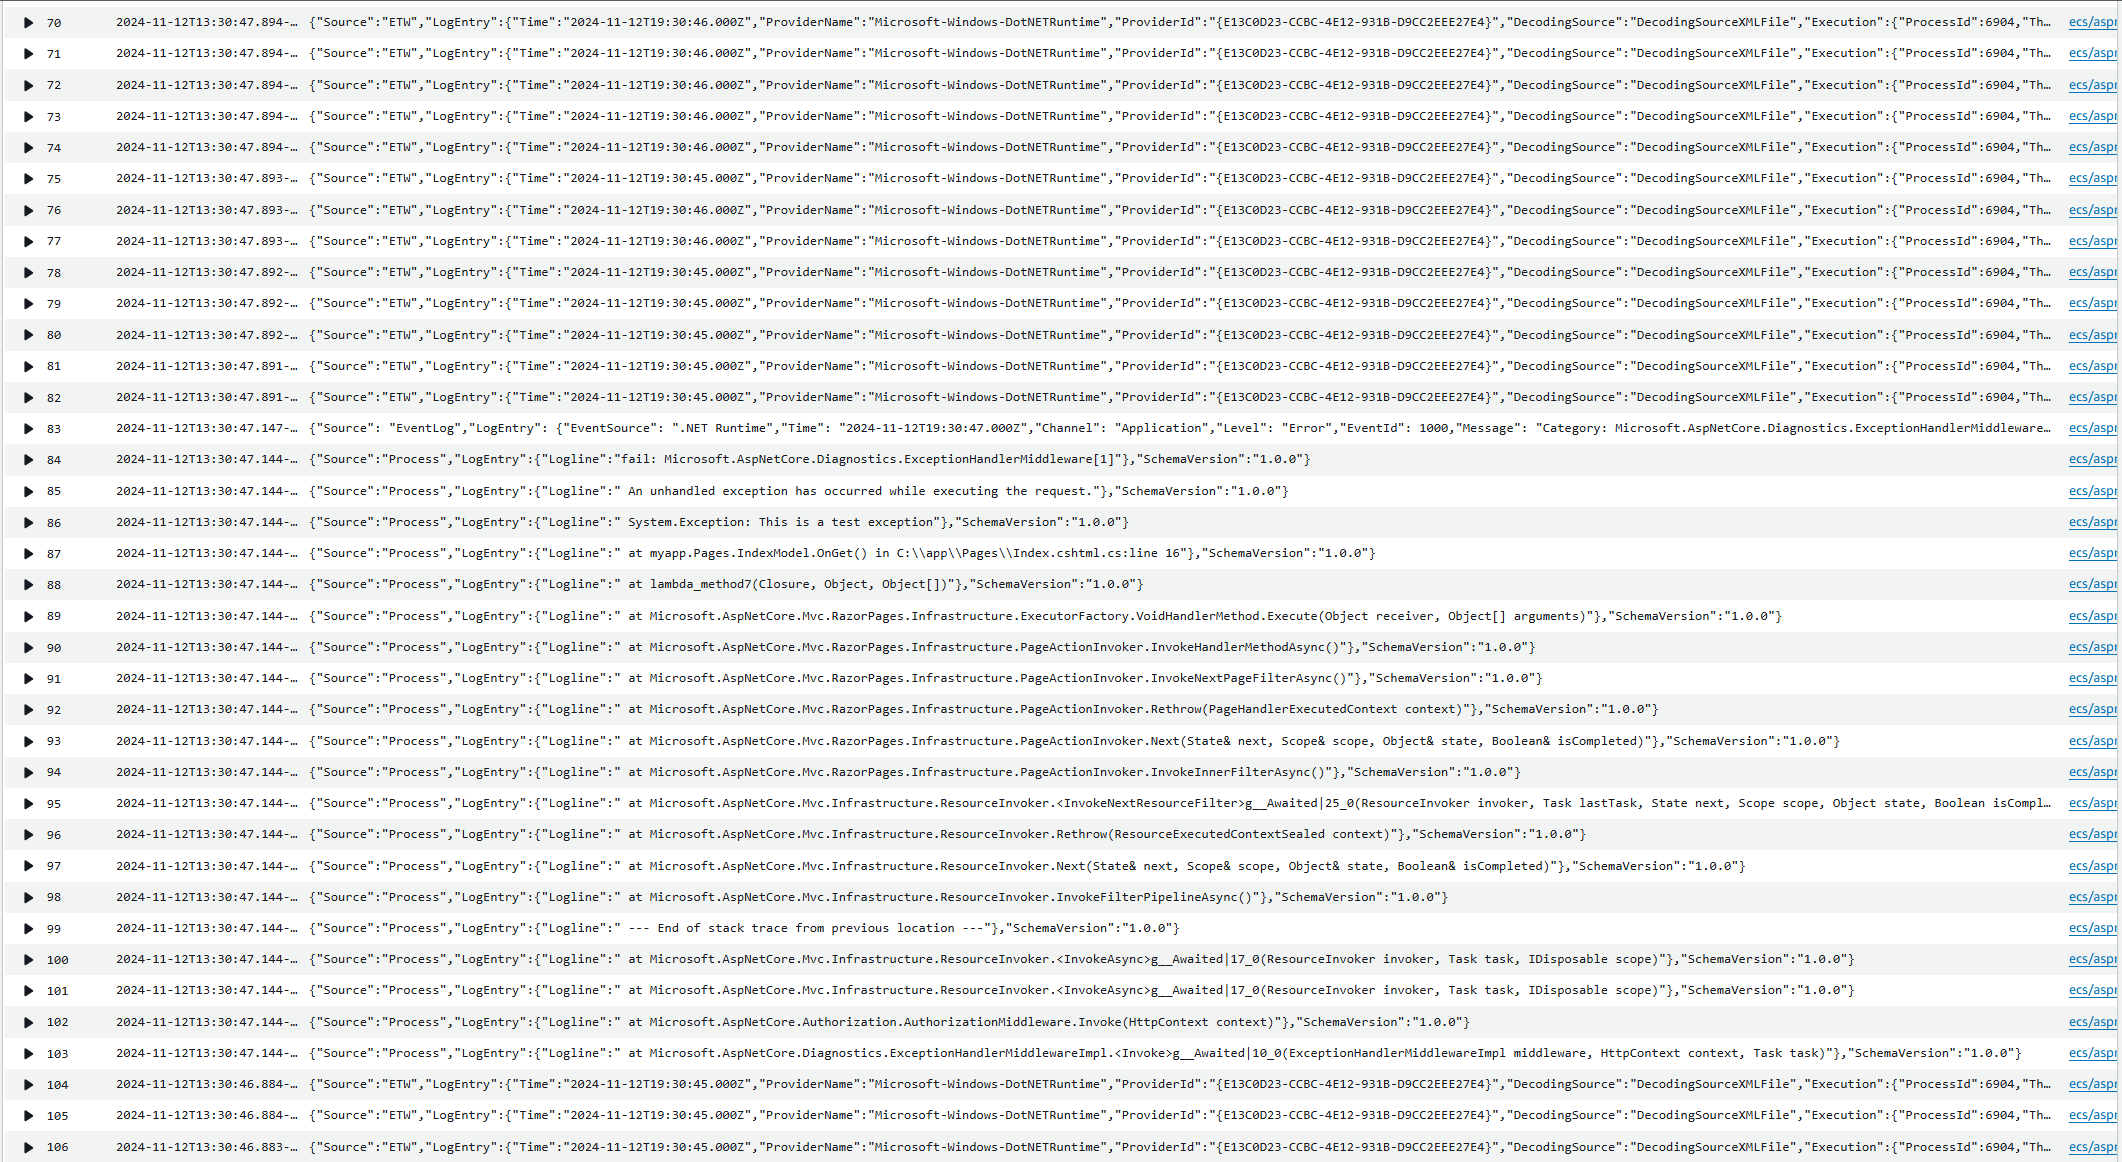
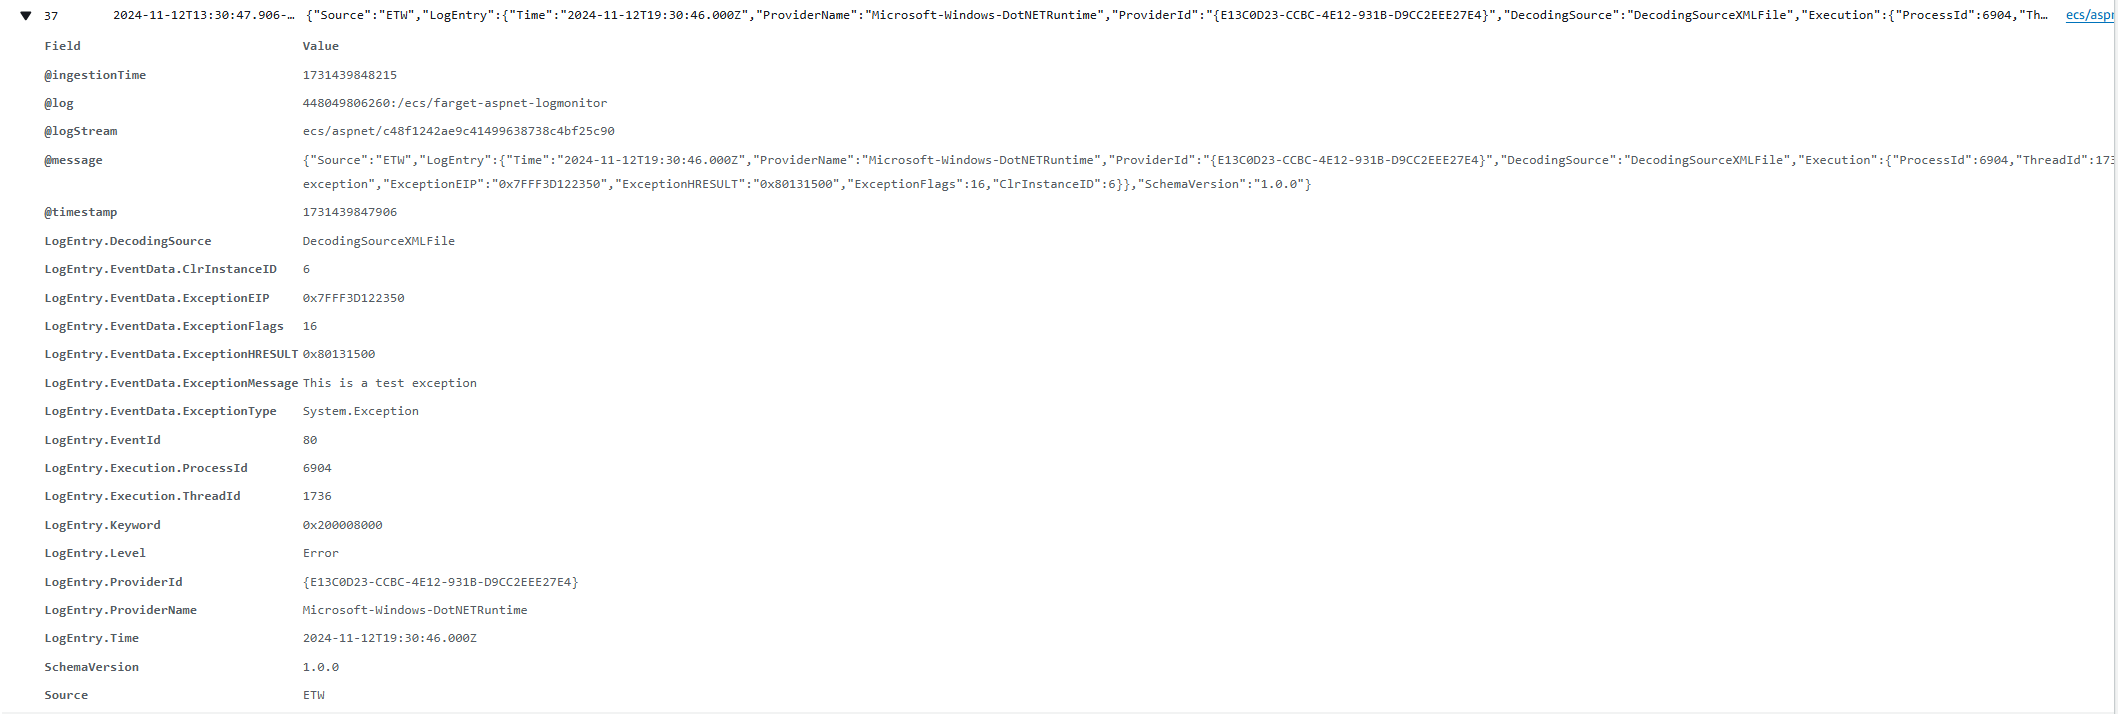
Windows applications often use different logging mechanisms than their Linux counterparts. Instead of relying on STDOUT, Windows apps typically utilize Windows-specific logging methods, such as ETW, the Event Log, or custom log files like IIS logs. If you’re running a Windows container in an ECS cluster and want to capture Windows and IIS logs in CloudWatch, you’ll need to implement Log Monitor instrumentation. This setup redirects IIS and system logs to STDOUT, allowing the awslogs driver to automatically capture and forward them to CloudWatch Logs.

Setting Up Log Monitor and CloudWatch for IIS Logs

Follow these steps to configure Log Monitor and send IIS logs to CloudWatch:

  1. Identify the Log Providers.

    Determine the providers to include in the configuration file using:

    logman query providers | findstr "<GUID or Provider Name>"

    For IIS, you can use:

    IIS: WWW Server with GUID 3A2A4E84-4C21-4981-AE10-3FDA0D9B0F83

  2. Create the LogMonitorConfig.json file.

    This file specifies which logs to capture. Below is an example configuration capturing system logs, application logs, and IIS logs:

     {
       "LogConfig": {
         "sources": [
           {
             "type": "EventLog",
             "startAtOldestRecord": true,
             "eventFormatMultiLine": false,
             "channels": [
               {
                 "name": "system",
                 "level": "Information"
               },
               {
                 "name": "application",
                 "level": "Error"
               }
             ]
           },
           {
             "type": "File",
             "directory": "c:\\inetpub\\logs",
             "filter": "*.log",
             "includeSubdirectories": true,
             "includeFileNames": false
           },
           {
             "type": "ETW",
             "eventFormatMultiLine": false,
             "providers": [
               {
                 "providerName": "IIS: WWW Server",
                 "providerGuid": "3A2A4E84-4C21-4981-AE10-3FDA0D9B0F83",
                 "level": "Information"
               },
               {
                 "providerName": "Microsoft-Windows-IIS-Logging",
                 "providerGuid": "7E8AD27F-B271-4EA2-A783-A47BDE29143B",
                 "level": "Information"
               }
             ]
           }
         ]
       }
     }
    
  3. Download Log Monitor

    Download LogMonitor.exe from the GitHub repository binaries.

  4. Update Your Dockerfile

    Integrate Log Monitor into your Docker container. Refer to the usage guide here.

    Example Dockerfile:

     FROM mcr.microsoft.com/windows/servercore/iis:windowsservercore-ltsc2022
    
     WORKDIR /LogMonitor
    
     COPY LogMonitorConfig.json LogMonitor.exe ./
    
     ENTRYPOINT ["C:\\LogMonitor\\LogMonitor.exe", "C:\\ServiceMonitor.exe", "w3svc"]
    
  5. Configure CloudWatch Logs in the Task Definition

    Enable CloudWatch logs and set up the log driver in your ECS task definition:

    Task definition example:

     "logConfiguration": {
         "logDriver": "awslogs",
           "options": {
             "awslogs-group": "/ecs/iis-logs",
             "awslogs-create-group": "true",
             "awslogs-region": "us-east-1",
             "awslogs-stream-prefix": "ecs"
          }
       }
    
  6. Rebuild and Deploy

    • Rebuild the container image and push it to your ECR repository.
    • Update the ECS task definition to use the new image and deploy it to the cluster.

Viewing Logs in CloudWatch

  1. Open the Amazon ECS console.
  2. Navigate to the cluster containing the task.
  3. Select the Tasks tab and choose a task to view.
  4. Expand the container details by clicking the arrow next to its name.
  5. In the Log Configuration section, select View logs in CloudWatch to access the log stream.

Example Outputs

  • ETW and Log Entries:

    cloudwatch

  • Application Exceptions:

    applicationerror

Building a custom API Gateway with YARP

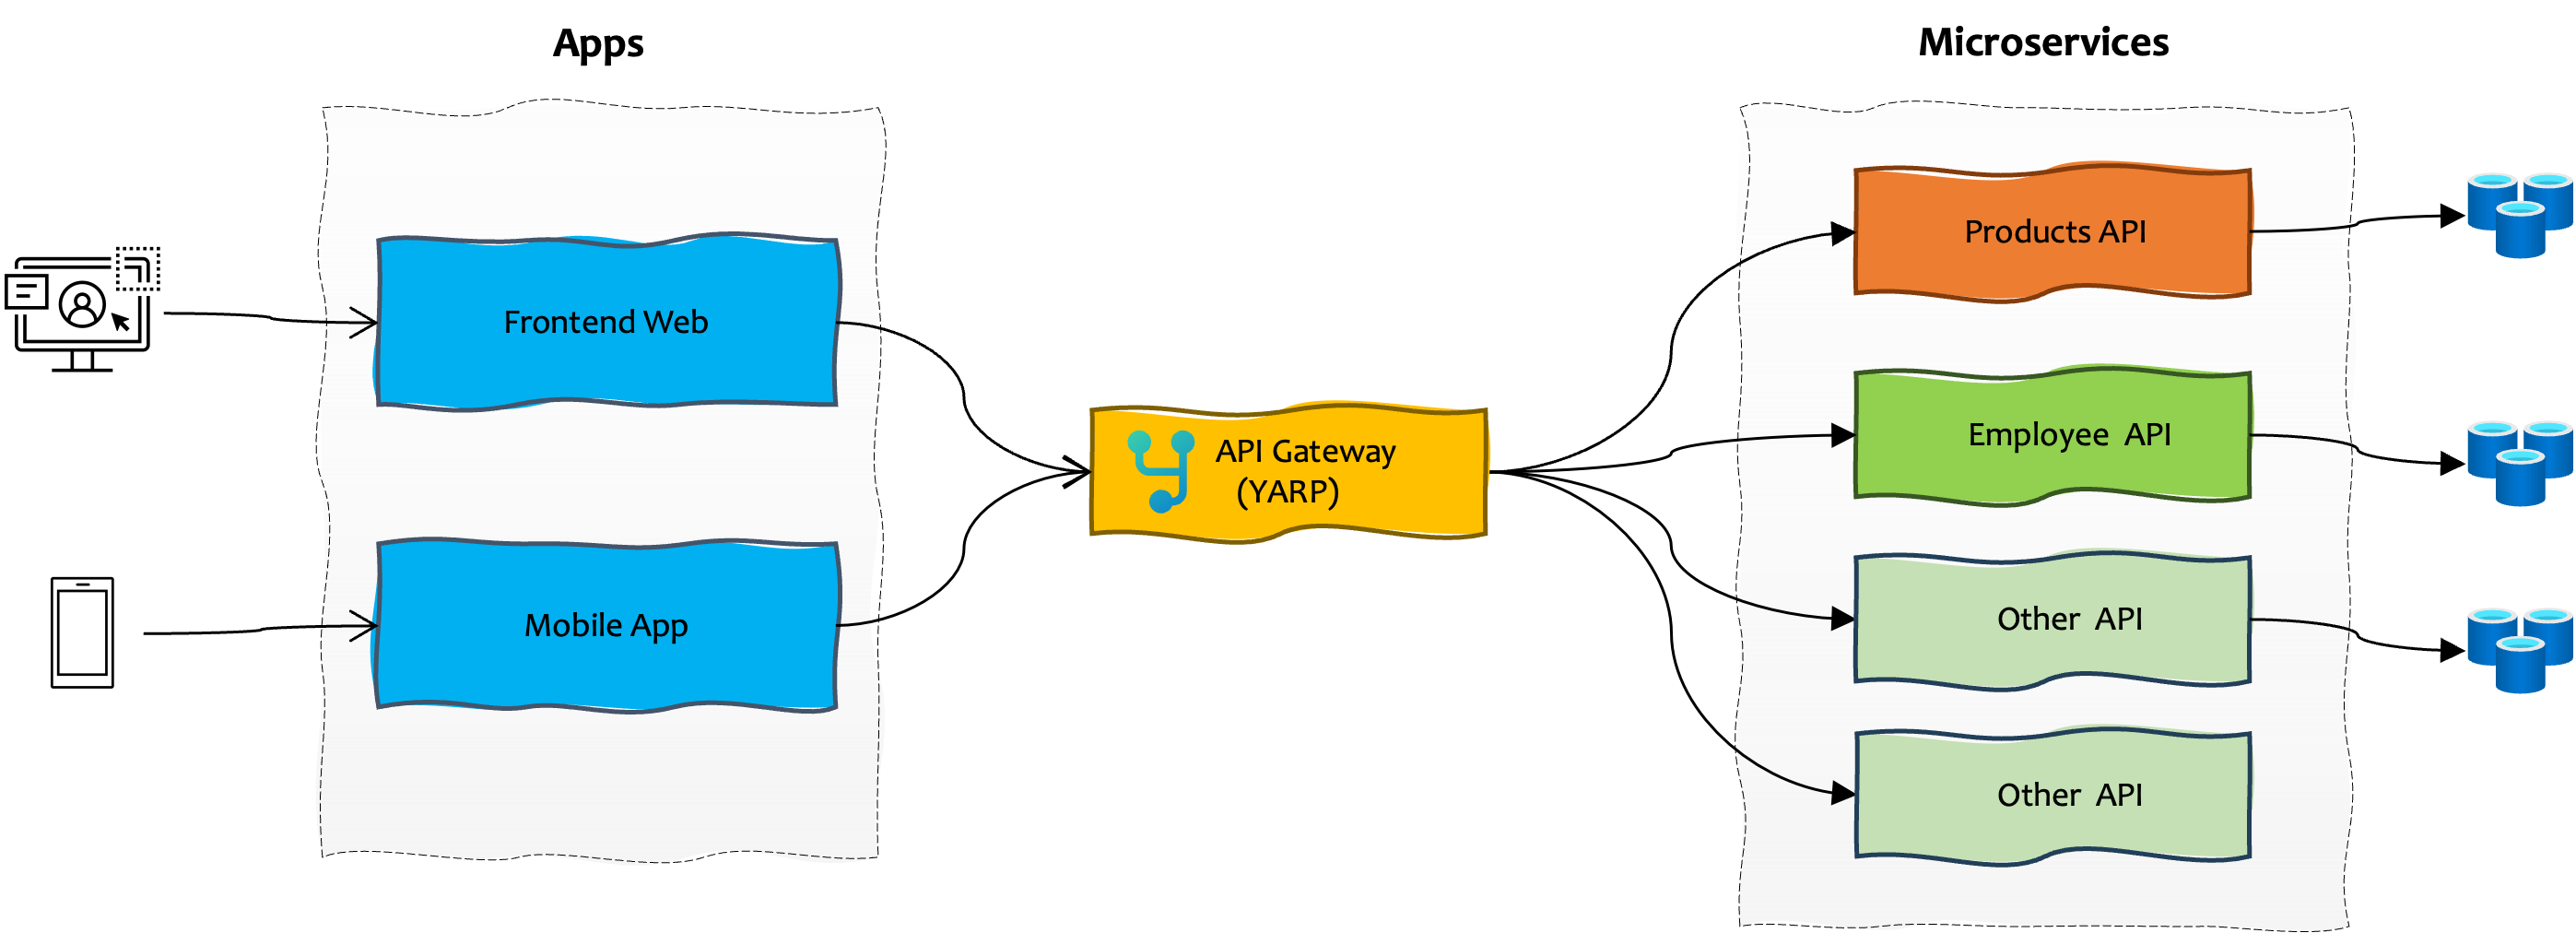
Whenever you are designing an architecture with microservices, you might encounter in how to implement an API Gateway, since you need a way to communicate and consume multiple services, generally through APIs. A possible solution is to have a single entry point for all your clients and implement an API Gateway, which will handle all the requests and route those to appropiate microservices.

There are different ways to implement an API Gateway or pay for built-in services in cloud hostings.

In this post I will pick the easiest way that I found to create one for a microservice architecture using .NET and YARP. Here is a general overview of a microservice architecture.

architecture

YARP

YARP (which stands for “Yet Another Reverse Proxy”) is an open-source project that Microsoft built for improving routing through internal services using a built-in reverse proxy server. This become very popular and was implemented for several Azure products as App Service.

  • To get started, you need to create an ASP.NET core empty project. I chose .NET 7.0 for this post.
dotnet new web -n ApiGateway -f net7.0
Install-Package Yarp.ReverseProxy
<Project Sdk="Microsoft.NET.Sdk.Web">

  <PropertyGroup>
    <TargetFramework>net7.0</TargetFramework>
    <Nullable>enable</Nullable>
    <ImplicitUsings>enable</ImplicitUsings>
  </PropertyGroup>

  <ItemGroup>
    <PackageReference Include="Yarp.ReverseProxy" Version="2.0.1" />
  </ItemGroup>

</Project>
  • Add the YARP middleware to your Program.cs.
var builder = WebApplication.CreateBuilder(args);
builder.Services.AddReverseProxy()
    .LoadFromConfig(builder.Configuration.GetSection("ReverseProxy"));
var app = builder.Build();
app.MapReverseProxy();
app.Run();
  • To add the YARP configuration you will use appsettings.json file. YARP uses routes and clusters, regularilly inside ReverseProxy object defined in builder configuration section. You can find more information about different configuration settings here.

  • In this example, I am using Products and Employee microservices. So I will have routes like employee-route and product-route and clusters as product-cluster and employee-cluster pointing to destinations. Open your appsettings.json and apply the following configuration.

{
  "ReverseProxy": {
    "Routes": {
      "product-route": {
        "ClusterId": "product-cluster",
        "Match": {
          "Path": "/p/{**catch-all}",
          "Hosts": ["*"]
        },
        "Transforms": [
          {
            "PathPattern": "{**catch-all}"
          }
        ]
      },
      "employee-route": {
        "ClusterId": "employee-cluster",
        "Match": {
          "Path": "/e/{**catch-all}",
          "Hosts": ["*"]
        },
        "Transforms": [
          {
            "PathPattern": "{**catch-all}"
          }
        ]
      }
    },
    "Clusters": {
      "product-cluster": {
        "Destinations": {
          "destination1": {
            "Address": "http://localhost:3500/v1.0/invoke/product-api/method/"
          }
        }
      },
      "employee-cluster": {
        "Destinations": {
          "destination1": {
            "Address": "http://localhost:3500/v1.0/invoke/employee-api/method/"
          }
        }
      }
    }
  }
}
  • In scenarios that you need to allow CORS to specific origins you can add a cors policy described in this Microsoft Doc. Here is a configuration example:
var builder = WebApplication.CreateBuilder(args);
var allowOrigins = "_allowOrigins";
builder.Services.AddCors(options =>
{
    options.AddPolicy(allowOrigins, policy =>
    {
        policy
          .WithOrigins("http://localhost:3000", "http://127.0.0.1")
          .SetIsOriginAllowedToAllowWildcardSubdomains()
          .AllowAnyHeader()
          .WithMethods("GET", "POST", "PUT", "DELETE")
          .AllowCredentials();
    });
});
var app = builder.Build();
app.UseCors(allowOrigins);
  • Then add this CORs policy inside Routes as followed:
"Routes": {
      "product-route": {
        "ClusterId": "product-cluster",
        "CorsPolicy": "_allowOrigins",
        "Match": { "..." },
        "Transforms": [ "..."]
      },
}
  • Finally if you want to get more information about YARP logging for future debugging or production information, you can add the YARP log level (Information,Warning or Error) inside Logging object as followed:
  "Logging": {
    "LogLevel": {
      "Default": "Information",
      "Yarp": "Information",
      "Microsoft.AspNetCore": "Warning"
    }
  }
  • Run the application with dotnet run and use Postman or curl to test the endpoints defined in your paths e.g. http://localhost:5212/p/v1/.

    Check all possible configurations and transformations in the YARP documentation.